Our recent webinar “Boost Your Reporting Efficiency: Accelerate Month-end Analysis With Power BI” covered how Microsoft Power BI can help improve the efficiency of the month-end financial closing process.
The topics covered in this webinar included;
Expectations vs. Reality: The Factors That Slow Down The Month-end Close
The gap between expectations and reality; challenges faced in the reporting process
In an ideal world, the month-end financial closing process would commence in the middle of the month, with the financial reports being created 10 days into the process. Analysis of these month-end reports would be concluded several days after, just in time to be presented to the owner or committee in charge of the business at month’s end.
Unfortunately, delays often occur when errors are found in the general ledger (GL) records, which have to be corrected at the last minute. This in turn means that the month-end reports must be revised potentially multiple times.
This a tedious and time-consuming task; especially if multiple versions of the same report, such as month-to-date (MTD), quarter-to-date (QTD) and year-to-end (YTD) are required. Because of this, by the time the reports are properly revised to reflect the correct data, there might be little time left to analyse them before presentation to the decision-makers, which could lead to further ramifications for the business down the line.
Highlights From The Power BI Demo
During the webinar, Bing presented a demo to show how you can use Power BI to generate financial reports from your data in less time than before, and thus minimise any delays in the month-end financial closing process.
Here are the highlights from the demo:
Creating MTD, QTD, And YRD Financial Reports
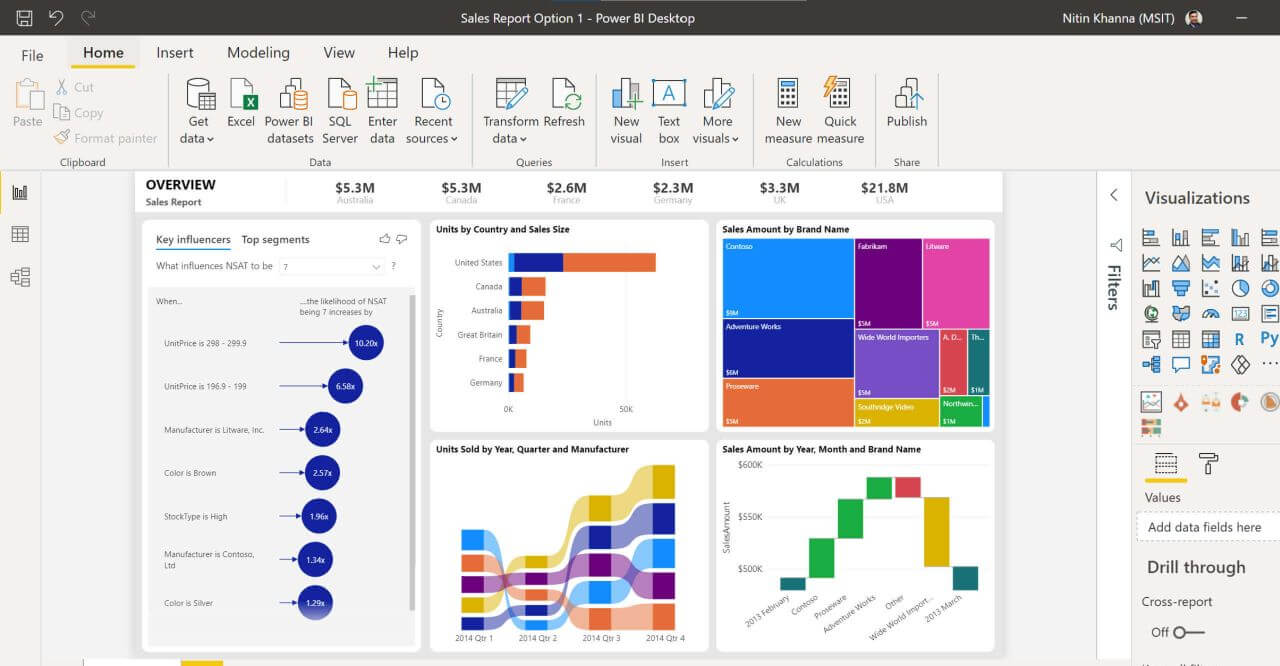
Quick demo of creating a pivot table dashboard
In the demo, Bing showed how easy it is to create a MTD financial report by first creating a table visualisation, then using the drag-and-drop functionality to include relevant columns in the visualisation. Basic measures in Power BI - such as MTD Totals - are similar to Excel formulae, so long-time Excel users will find it easy to get started with Power BI.
The raw financial data downloaded into Power BI can be sliced by distinct categories, such as revenue types, month-to-date, and year/month. With this, you can generate some basic financial reports that display only the data you need by each category.
Featuring QTD data in pivot table dashboard
Another type of financial report required for the month-end close is the quarter-to-date (QTD) report. To create this, Bing showed how the “Total QTD” measure can be used to change the context of the Finance Amount to refer to the current quarter.
This produces a column that shows how the total amount accumulates over the three months spanning a specific quarter, and only those three months. The count restarts with a month belonging to the next quarter, ensuring that the quarter-to-date count remains accurate.
Last but not least, the year-to-date (YTD) report is another that’s required for the month-end close. The process for generating one is similar to the one for the QTD report, and produces the same kind of count, except for up until the last month of the current year.
Creating Reports By Account Type, And Compare By Year
Using Slicers For Further Targeted Analysis
Bing also demonstrated how you could adjust the slicers on the report to display data broken down by other categories, in the course of the demo. For example, the table could display the financial amount broken down by account types, which could then be further sliced by MTD and QTD – producing reports which broke down the revenue from each account by month, and by quarter.
You can also use Power BI to compare the current QTD report from the same quarter one year ago, to find out how the business performed as compared to the same time last year.
Creating Reports by Subsidiary
Creating reports for multiple subsidiaries
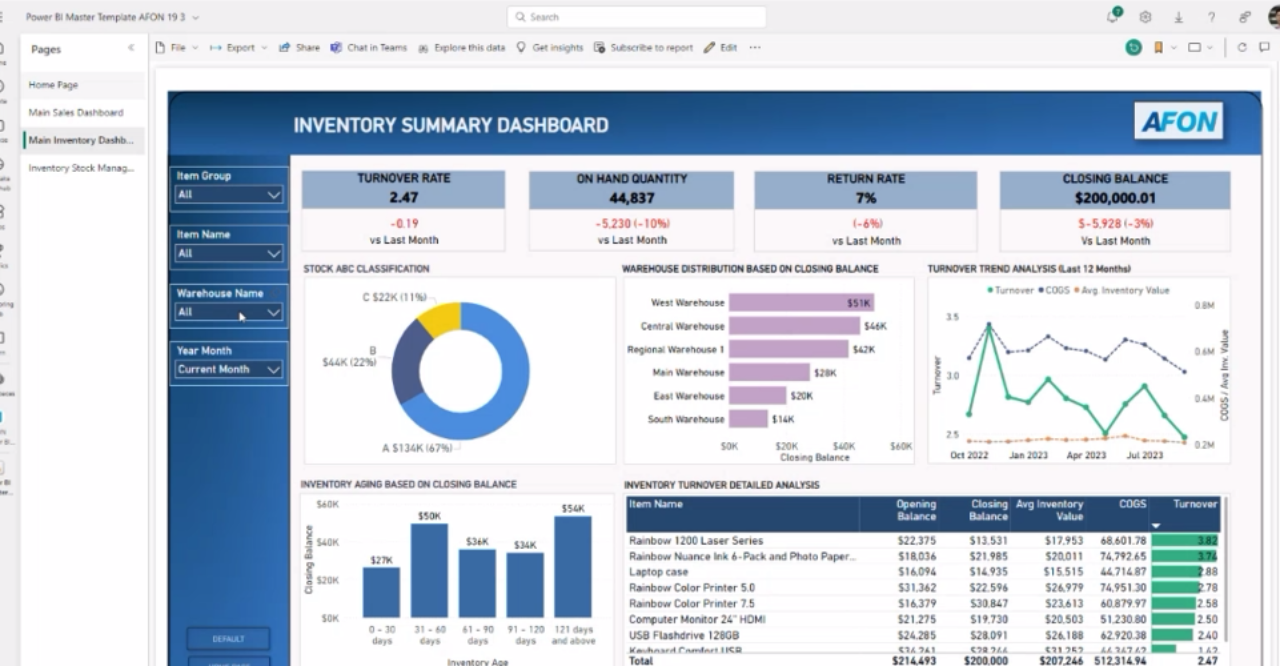
Bing also demonstrated how you could use Power BI to generate reports from multiple subsidiaries at once. By choosing the ‘Subsidiary’ column, you could produce a report that compares revenue information by subsidiary; this lets you see which ones are performing well financially, and which ones are not.
He also showed how Power BI could visualise this information, showing how the data could be instantly converted to a waterfall chart with a click of the button. A waterfall chart is key for visualising differences when comparing across time periods, using the familiar colours green and red to signal positive and negative changes. This enables finance professionals to quickly derive insights.
AFON’s Financial Month-end Package For Power BI
Introducing AFON's Financial Month-end Package For Power BI
After the demo, Bing introduced a downloadable month-end package for Power BI, designed by AFON to help Power BI users generate the multiple types of financial reports necessary for the month-end financial close.
When installed, the package provides a single interactive screen that contains all of the aforementioned functionalities of Power BI, giving you easy access to the following;
- MTD, QTD, YTD comparisons at the click of a button
- Loading of budgets for a complete comparison of
- Actual vs Budget
- Actual vs Last Year
- Interactive slicing of data to facilitate deeper insights
- Combine multiple business entities (for both SAP Business One and Microsoft Dynamics 365 Business Central)
- Printing of static copy for backup
All you need to do is to have your business’s financial data ready, and set up the desired options on the screen, to generate and automatically export the financial reports you need to Microsoft PowerPoint within a few minutes.
If you’d like to download our financial month-end package for Power BI, do give us a call at +65 6323 0901, or drop us a note and we’ll get back to your shortly.
Otherwise, if you'd like to know more about what Power BI can do for your business, click on the image below to download our all-in-one guide to Microsoft's data visualisation software.