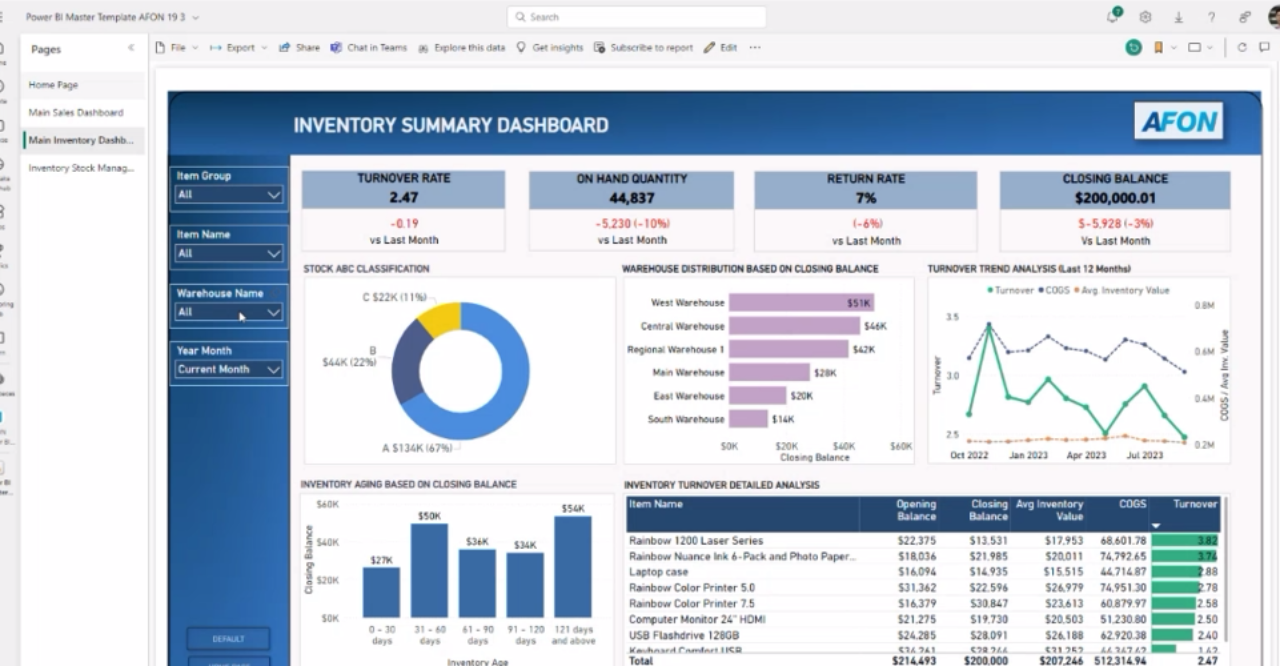
On 13 April 2023, AFON hosted a webinar exclusive to our customers. Presented by our Analytics Manager, Ho Bing Zhao, the webinar covered how businesses can leverage Microsoft Power BI to achieve faster and smarter reporting on their financial data.
Here are some of the highlights of our webinar.
The Need For Faster and Smarter Reporting
When it comes to reporting, some of the most common challenges businesses face are as follows;
- Too much time spent on gathering data from various sources and software system, then transforming and formatting it into a single template for consumption by business leaders.
- Traditional static reports and spreadsheets made it difficult to communicate and share insights gleaned from the dataset with other stakeholders in the business.
- Lack of ability to perform ad-hoc analysis of accumulated data, or to drill down into specific detail.
- Challenges in ensuring data quality, security, and governance across the business.
What Is Power BI?
Introduction to Microsoft Power BI; Source: Microsoft Power BI
During the webinar, we introduced Power BI as a business intelligence and visualisation tool developed by Microsoft that enables users to analyse, visualise, and share data insights through interactive dashboards and reports.
We also covered how Power BI can connect to a wide variety of data sources, including ERP software, spreadsheets, databases and cloud services. This allows Power BI to transform raw data from all of these sources into meaningful insights for end users.
Power BI also comes with several features that are not so well known. These include the ability to;
- Embed Power BI chart directly inside a PowerPoint presentation
- Automate emails with one click of a button
- Generate a single report that distributes different sets of data to different departments.
Dashboarding: Pro and Cons of Excel vs. Power BI
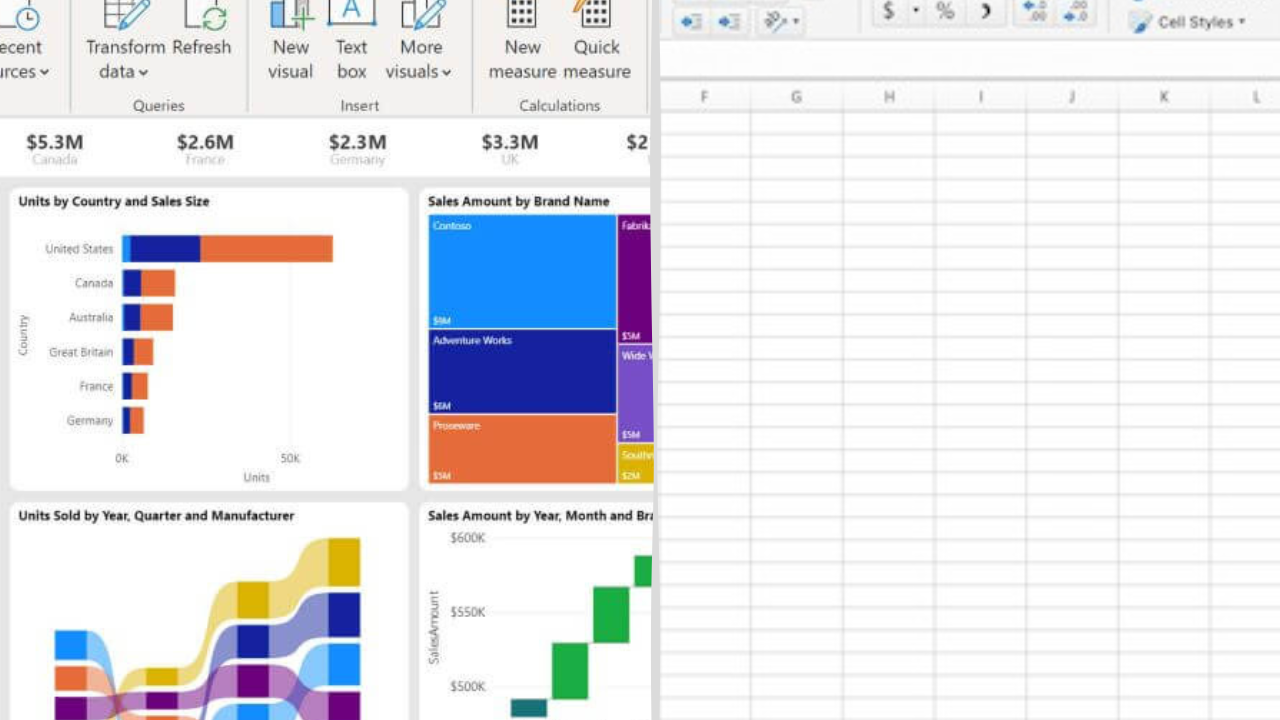
The differences between Excel and Power BI; Source: AFON IT
We also did a quick comparison of using Excel spreadsheets and Microsoft Power BI for your business’s reporting needs. Take a look at the snippet above for a quick look at how both solutions stack up against each other.
See How Jet Reports And Power BI Compare With Each Other, And Why They Complement Each Other.
Moving from Excel-based insight to Power BI-based insight
Creating donut, gauge and waterfall charts in Power BI; Source: AFON IT
In the webinar, we covered the three stages that businesses would need to go through in order to transition their reporting from Excel to Power BI.
We also carried out a live demo of the second stage, which involves moving data between platforms by translating Excel formulae into Power BI Measures, as well as creating visualisations and dashboards to provide insights based on this data.
How AFON Can Help You in Your Power BI Journey
%20(1).png?width=1000&height=509&name=Power%20BI%20journey%20with%20AFON%20(1)%20(1).png) How we can support you in your Power BI Journey; Source: AFON IT
How we can support you in your Power BI Journey; Source: AFON IT
Last but not least, we covered how we at AFON IT Pte Ltd can help you with your implementation of Microsoft Power BI.
While Power BI can be used as a self-service reporting tool, it does require some installation and setup on the back end to work with your business’ data and systems in the most optimal way possible.
This can be a highly technical process, but with the data experts at AFON, we can help you optimise the way Power BI processes data in your business, set up the necessary security measures, configure your alerts, and provide support and maintenance for your Power BI instance after implementation.
To find out more about how we can help you with Power BI, do drop us a note here and our consultants will get back to you shortly. Alternatively, give us a call at +65 6323 0901.
Or, if you’d like to find out more about how Microsoft Power BI can transform your data into easily digestible and actionable insights for your business, click on the image below to download our free, all-in-one guide to Power BI today.


